


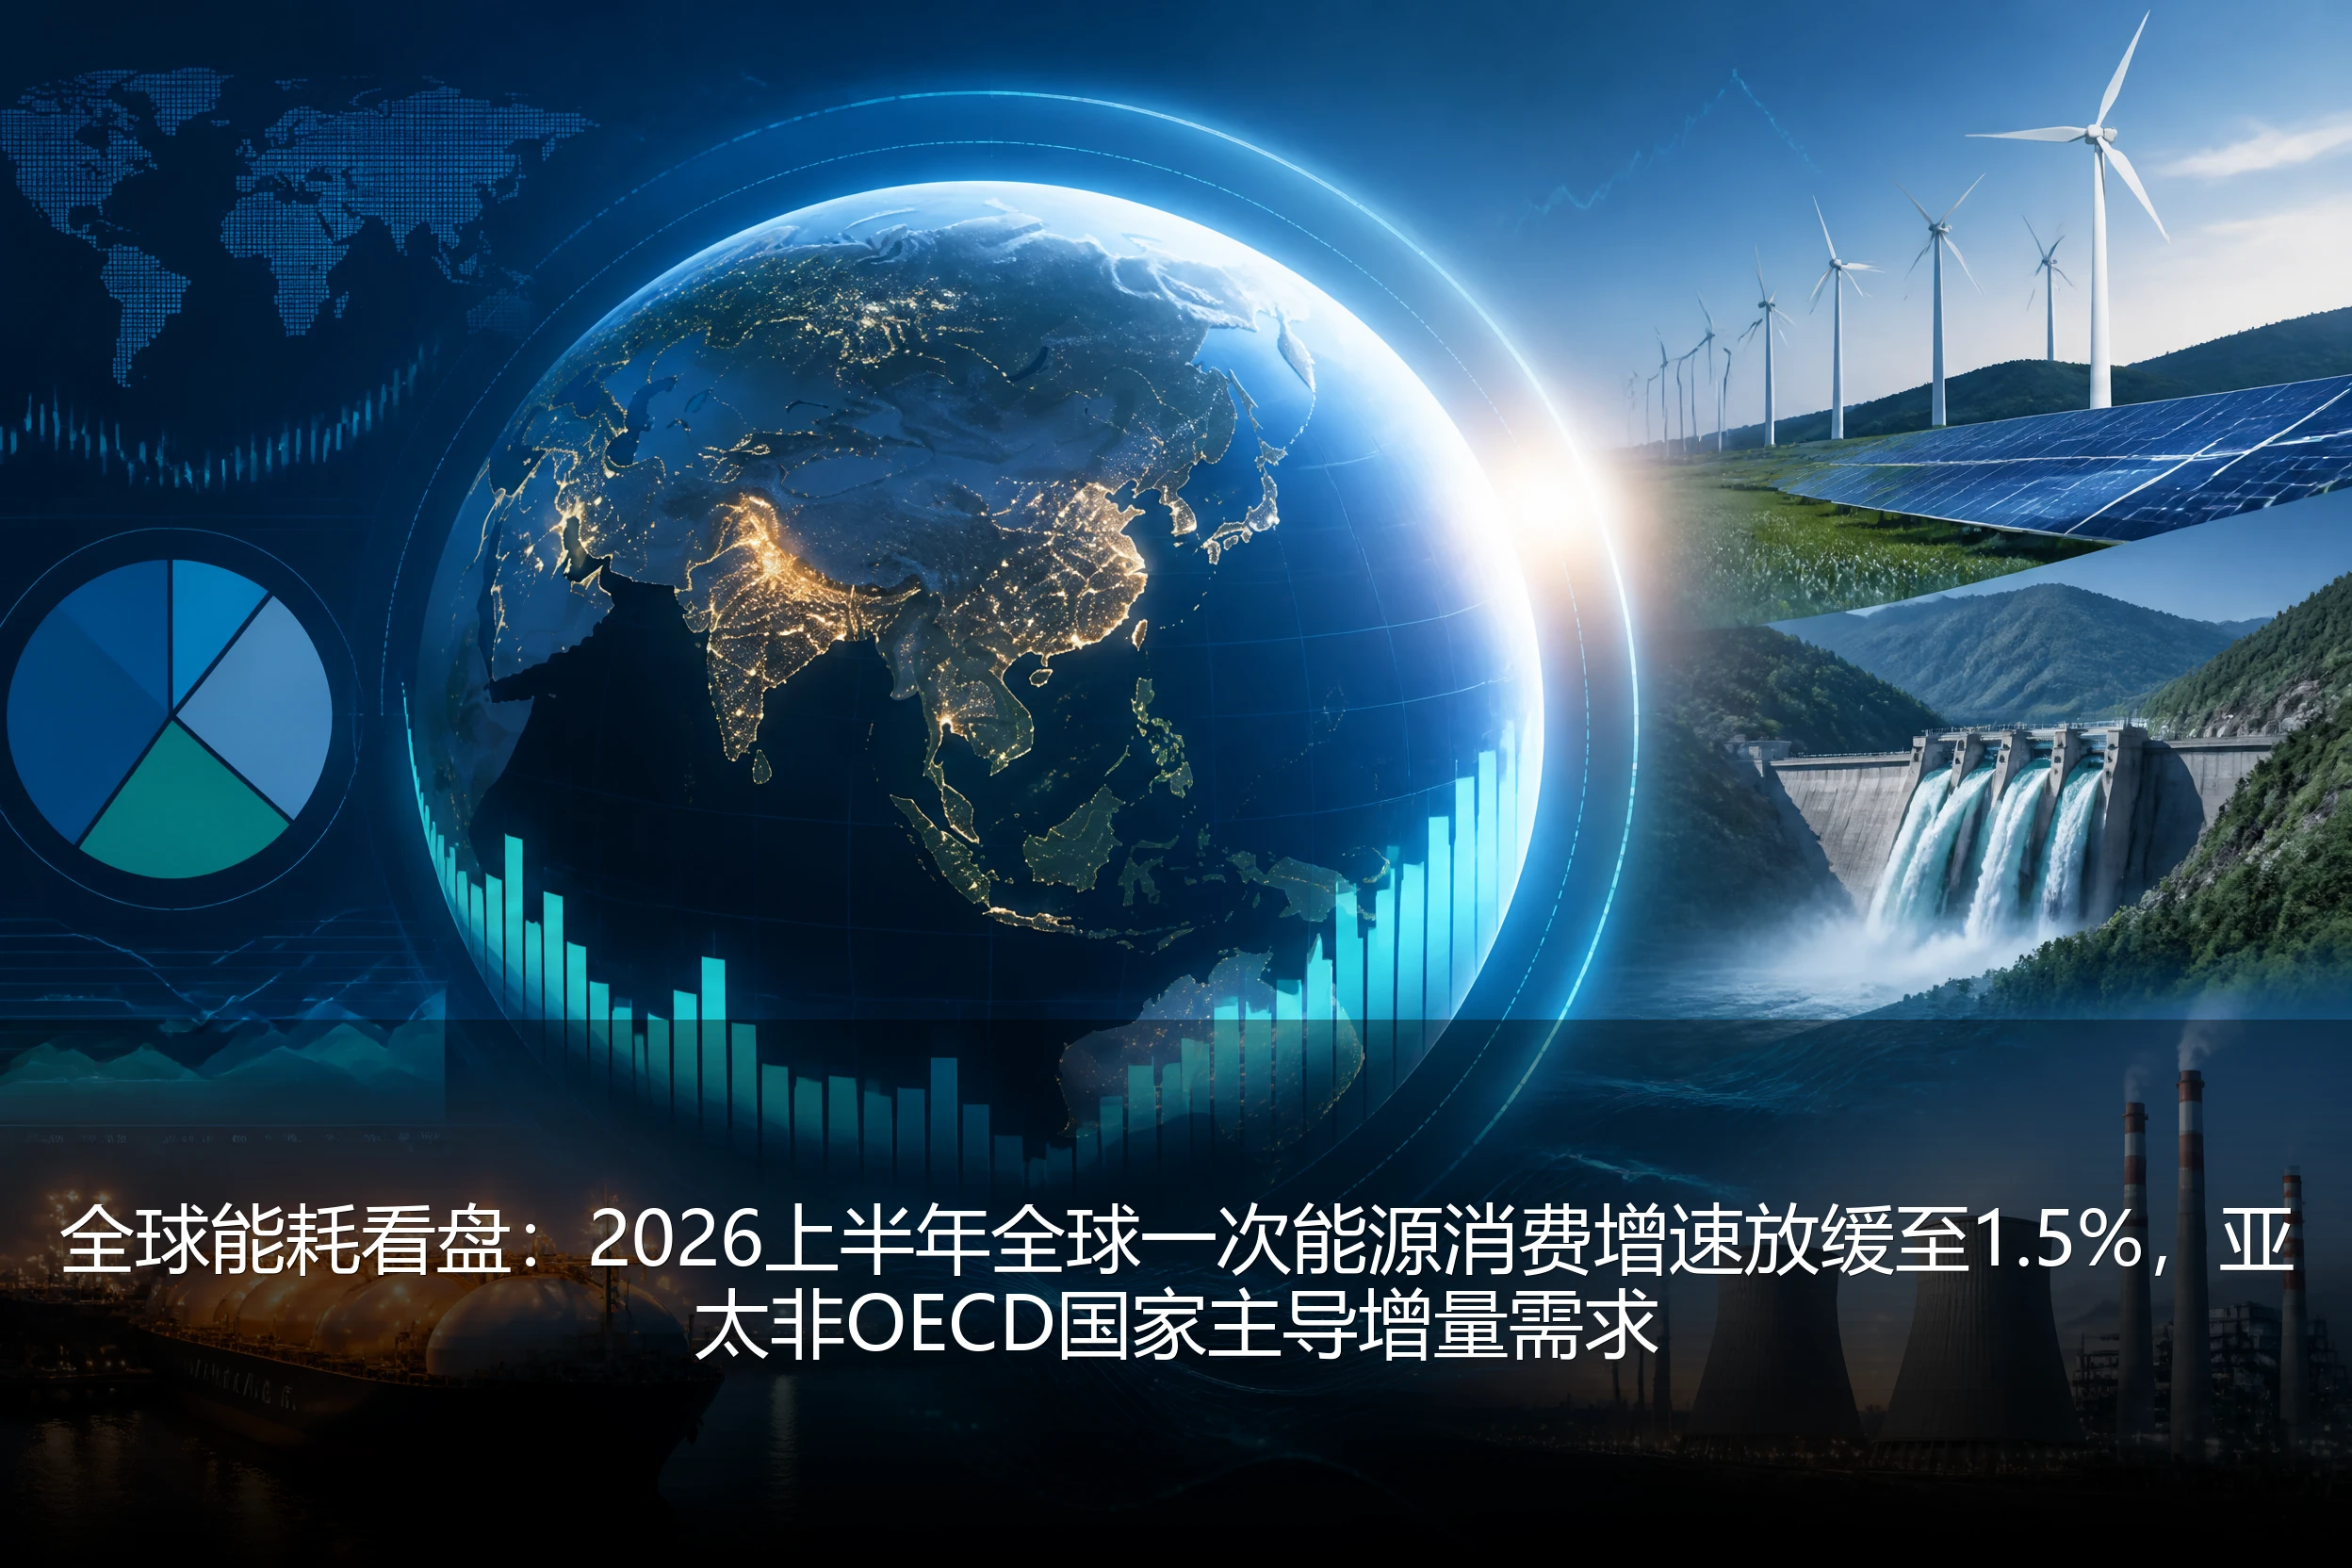
Global Energy Consumption Growth Engine Quietly Shifts: Asia-Pacific Non-OECD Countries Become Sole Incremental Driver
On August 3, 2026, the International Energy Agency (IEA) released the "Global Energy Consumption Tracking Report for the First Half of 2026." The data reveals a deeply reshaping global energy consumption landscape: from January to June 2026, global primary energy consumption totaled approximately 312 exajoules (EJ), with a year-on-year growth rate of only 1.2%, significantly narrowing from 1.8% in the same period of 2025. More noteworthy is the polarization of growth poles—Asia-Pacific non-OECD countries contributed 68% of the global increase in energy consumption, with China, India, and the three ASEAN countries (Vietnam, Indonesia, Philippines) jointly driving over 55% of the incremental growth, while energy demand in North America and Europe, under the dual effects of mild recession and improved electrification efficiency, only recorded a slight growth of 0.3%.
Behind this data is the deep migration of the global manufacturing landscape and electricity demand centers. China's industrial electricity consumption maintained a rigid growth rate of 3.8% driven by advanced manufacturing and AI computing infrastructure, but energy consumption in the building and transportation sectors has reached a turning point; India, due to continuous high temperatures increasing cooling loads combined with manufacturing expansion, saw its electricity demand growth surge to 7.2% in the first half, becoming the single largest contributor to global energy consumption growth. Meanwhile, the electricity consumption elasticity coefficient of emerging industrialized countries in Southeast Asia continues to exceed 1.5, meaning that for every 1% increase in GDP, electricity demand grows by more than 1.5%, indicating that the region is still in an energy density rising phase, forming a sharp contrast with the "economic growth decoupling from energy consumption" stage already entered by developed economies.
Qualitative Change in Global Energy Consumption Structure: Renewable Energy Share Exceeds 38%, Fossil Energy Internally Accelerating Differentiation
From the perspective of energy consumption structure, the penetration rate of renewable energy has exceeded the early-year expectations of most institutions. In the first half of 2026, the share of renewable energy such as wind, solar, water, and biomass in primary energy consumption climbed to 38.2%, an increase of 2.7 percentage points compared to the same period in 2025. Solar power generation surged 28% year-on-year, wind power grew by 14%, and together they contributed to over 80% of the new global electricity generation. China's renewable energy installation breaking 1.8 billion kilowatts, the dense grid connection of offshore wind clusters in Europe, and the continuous release of tax credit effects from the US Inflation Reduction Act have jointly driven this leapfrog growth.
However, fossil energy is not uniformly affected internally. Benefiting from the decline in Asia-Pacific LNG spot prices and European inventory replenishment demand, natural gas consumption increased by a mere 1.5% year-on-year, becoming the only category of fossil energy to achieve positive growth. Oil consumption growth slowed to 0.8%, mainly dragged by factors such as China's new energy vehicle penetration rate exceeding 55% and the accelerated elimination of diesel vehicles in Europe. After a brief plateau in 2025, coal has returned to a downward trajectory—global coal consumption decreased by 2.1% in the first half, with China contributing the main decline, with a quarterly coal consumption decline of 4.2% in the second quarter alone. This set of data clearly shows that the "phase-out" of fossil energy is not synchronized; the role of natural gas as a transition fuel is still being strengthened, while coal has taken the lead in entering an irreversible long-term contraction cycle.
Energy Watch: Regional Polarization Intensifies, "Efficiency Dividends" Behind Europe's Energy Consumption Decline
Europe's energy consumption decreased by 1.4% in the first half of 2026, but this is not entirely a signal of economic weakness. Breaking it down, natural gas consumption in Europe's industrial sector fell by 5%, while electricity consumption only decreased slightly by 0.6%. This "gas down, electricity stable" pattern is driven by the acceleration of Europe's industrial electrification process—the application of heat pumps, electric boilers, and industrial heat pumps is replacing traditional natural gas heating. Meanwhile, the cumulative effect of Europe's building energy efficiency retrofits is beginning to show, with heating energy consumption per unit area decreasing by about 15% compared to 2020.
In contrast, the zero growth in North American energy consumption is more related to the economic cycle. The US June non-farm data was far below expectations, with the manufacturing PMI below the threshold for three consecutive months, and the operating rate of energy-intensive industries declined, directly dragging down industrial electricity and natural gas demand. This "passive energy reduction" contrasts sharply with Europe's "active energy efficiency improvement," also determining the divergent direction of future energy investment tracks: Europe's investment opportunities are more focused on energy efficiency technologies, smart grids, and distributed energy management, while North America needs to pay attention to the pulse-like pull of traditional energy demand driven by the economic recovery rhythm.
Investment Insights in the Energy Dividend Period: Shifting from Volume-Driven to Structure-Driven
For energy investors, the structural changes in global energy consumption data release three clear signals. First, the track of energy investment has shifted from "volume growth" to "structural substitution"—even if the global energy consumption growth rate slows to around 1%, renewable energy can still expand with double-digit growth rates, which means that new energy investment logic is not constrained by traditional cycles, but is dominated by the "substitution dividend" driven by technological progress and policy. Second, Asia-Pacific non-OECD countries are the absolute main force for global energy consumption growth in the next decade, and the power infrastructure, renewable energy installation, and energy storage demand in China, India, and Southeast Asia will continue to release, with relatively high investment certainty in related industrial chains. Third, the long-term decline of coal is a foregone conclusion, but its exit rhythm is not linear—extreme weather, geopolitical conflicts, or fluctuations in renewable energy output may trigger periodic coal price rebounds, and investors need to be wary of "volatility in decline."
Looking at specific tracks, the investment value in long-duration energy storage, hydrogen infrastructure, smart grids, and energy management software is being rapidly realized. IEA data also shows that in the first half of 2026, global new energy storage installations reached 85GW, a year-on-year increase of over 40%, with Asia-Pacific accounting for more than 60%. This data is in complete alignment with the demand for high-penetration grid connection of renewable energy—when the penetration rate of solar and wind power breaks through the critical point, energy storage is no longer an option but a rigid demand. The core trend revealed by the Global Energy Watch is already clear: the slower the energy consumption growth, the more concentrated the structural opportunities in energy investment, and the more severe the differentiation between old and new energy.
